LABOR MARKET DATA
*based on Emsi Q1 2022 Data Set
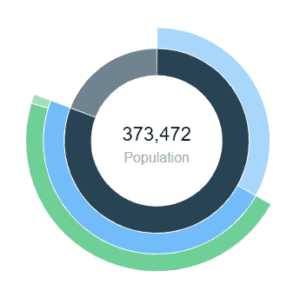
2021 Labor Force Breakdown

| Population | ||
|---|---|---|
| Employable Population | 301,583 | |
| Not in Labor Force (15+) | 123,159 | |
| Labor Force | 178,424 | |
| Employed | 174,038 | |
| Unemployed | 4,386 | |
| Unemployable Population | 71,889 |
373,472
Population (2021)
Population grew by 10,205 over the last 5 years and is projected to grow by 11,484 over the next 5 years.
162,852
Total Regional Employment
Jobs decreased by 1,702 over the last 5 years but are projected to grow by 7,666 over the next 5 years.
$54.9K
Avg. Earnings Per Job (2021)
Regional average earnings per job are $21.8K below the national average earnings of $76.6K per job.
DOWNLOADABLE REPORTS
- Colliers International 10 Emerging U.S. Industrial Markets to Watch in 2021
- Colliers International 10 Emerging U.S. Industrial Markets to Watch in 2019
- Economic Impact of Unfilled Positions in the Shenandoah Valley, January 2021
- Food & Beverage Manufacturing Infographic: A Recipe for Success
- SVP 2021-2022 Annual Report
- SVP 2020-2021 Annual Report
- SVP 2019-2020 Annual Report
- SVP Strategic Plan (2021 Update)
- Shenandoah Valley Community Profile
- Harrisonburg-Rockingham MSA Community Profile
- Staunton-Augusta-Waynesboro MSA Community Profile
- Virginia Economic Development Partnership Guide to Incentives
- Virginia Economic Development Partnership Strategic Plan for Economic Development
- Ariake (now Kerry Group) – Expansion
- Case Study – The Hershey Company Produces Sweet Success in Virginia
- Case Study – Three Virginia Locations Serve Speyside Bourbon Cooperage
- ComSonics – Expansion
- DanoneWave – Expansion
- Draftco – Expansion
- Dynovis – New Manufacturing Facility
- Flow Alkaline Spring Water – New Manufacturing Facility
- Hutchins & Hutchins – Expansion
- InterChange – New Cold Storage New Facility
- Merck – Expansion
- Mohawk Industries – Expansion
- Munters Corporation – Expansion
- NIBCO – Expansion
- Provides – Expansion
- Shamrock Farms – Expansion
- Speyside Bourbon Stave Mill – Expansion
- Sumitomo – Expansion
- The Hershey Company – Expansion I
- The Hershey Company – Expansion II
- The Hershey Company – Expansion III
- The Hershey Company Produces Sweet Success in Virginia
- TruckVault, Inc. – New Manufacturing Facility
COST OF LIVING INDEX & QUALITY OF LIFE INDICATORS
|
Metro/Micro |
COL Index** | Mean Commute Time | Unemployment (Dec 2021) | Average Earnings Per Job (2021) | Population 2021 | Projected Population (2026) |
| Harrisonburg-Rockingham VA Metro | 96.8 | 19.8 minutes | 1,526 | $56,500 | 136,908 | 142,742 (+4.3%) |
| Staunton-Waynesboro-Augusta VA Metro | 97.5 | 23.1 minutes | 1,442 | $55,700 | 125,478 | 129,349 (+3.1%) |
| Lexington-Buena Vista-Rockbridge VA | 98.4 | 25.9 minutes | 396 | $50,400 | 36,668 | 37,766 (+2.9%) |
| Shenandoah Valley Partnership Region | 99.7 | 25.9 minutes | 4,386 | $54.900 | 383.482 | 384,596 (+3.1%) |
| Washington-Arlington-Alexandria VA Metro | 117.4 | 35.0 minutes | 1122,256 | $103,800 | 6,377,605 | 6,586,948 (+3.3%) |
| Richmond VA Metro | 103.9 | 25.3 minutes | 20,776 | $68,529 | 1,318,614 | 1,384,060 (+5%) |
| Virginia Beach-Norfolk-Newport News VA Metro | 103.7 | 24.6 minutes | 26,881 | $66,759 | 1,790,545 | 1,830,386 (+1%) |
| Charlottesville VA Metro | 106.4 | 23.4 minutes | 2,443 | $72,697 | 222,116 | 231,355 (+4%) |
| Winchester VA Metro | 100.6 | 31.8 minutes | 1,928 | $67,072 | 143,621 | 150,439 (+5%) |
*Source: Lightcast Q1 2022 Data Set
**COL Index: Lightcast’s cost of living data is based on the Cost of Living Index published by the Council for Community and Economic Research (C2ER).

